
Exuberant Concentration

Market rally and US dominance
Since the beginning of COVID (January 2020) global markets have rallied strongly. The MSCI All Country World Index (ACWI) is up over 74%, or 10.12% pa through September 2025. This growth has been relatively relentless with up quarters (15) almost double down quarters (8). The growth is impressive against a backdrop of global GDP growth over the same period of 17% or 2.6% pa. This performance has been led by the US equity markets which are up over 100%, or 13.5% pa, over the same period.
Chart 1[1]: Equity Performance: US vs Global Regions (2020-2025)
The effect of this dominant US equity performance over the past several years means that global investors have become increasingly concentrated in the US.
Chart2[1]: Market Cap % of developed world
This increasing US share of the global equity market is not based in economic reality. While developed world US equity exposure has grown by 72% (to 73%) since 2018, the US share of global GDP has grown by just 14%. So we find ourselves in 2025 where the concentration in the US is significantly overweight its share of the global economy, on both a nominal and PPP (purchasing power parity) basis.
Chart 3[2]: US Equity market equity overweight relative to GDP
This delinking of equity exposure from economic reality is especially stark when we consider the fact that the US is now running a net investment income deficit for the first time.
Chart 4[3]: US net investment income
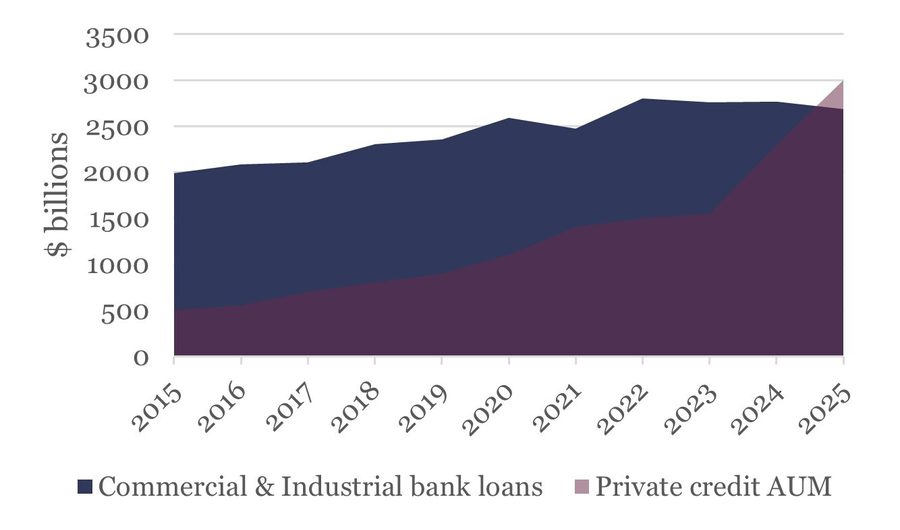
At the same time the US financial system is being turned on its head with the growth of non-bank financing. While there are pros and cons to the private credit market, all agree that it lacks transparency and regulation and therefore makes risk forecasting all but impossible.
Chart 5[4] Commercial and Industrial bank loans vs Private credit AUM
Shifts in global allocation
It is clear, to us at least, that central banks and other global reserve asset owners have responded to this state of affairs by directing allocations away from US equities and away from the US dollar. Gold is at an all time high for a reason and the operating leverage of gold miners has driven their price performance even higher.
Chart6[5]: Gold and gold miners - price trends in 2015
At the same time the US dollar has continued to weaken despite US rates remaining persistently high relative to others.
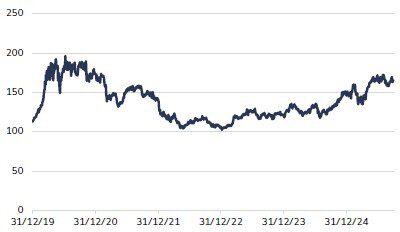
Chart 7[5]: Currency - value of USD Jan 1 = 100
Chart 8[5]: 10 year rates
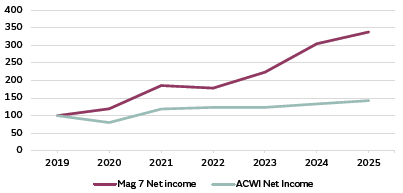
It is safe to assume that the love affair for US equities is not reflective of a macro perspective. Indeed, it is overwhelmingly driven by private investor appetite for a handful of securities. This appetite is personified by silly acronyms: the Magnificent Seven (Apple, Microsoft, Amazon, Alphabet, Tesla, Nvidia and Meta) or Batman (Broadcom, Alphabet, Apple, Tesla, Meta, Amazon and Nvidia). Both movies share the theme of violence to protect society, hardly a coherent way to construct an investment portfolio. But both the Magnificent Seven and Batman win in the end and the earnings performance of this tiny cohort does merit serious allocation attention.
Chart 9[6]: Net income growth 2019=100
But does serious attention mean an over threefold allocation increase within US equities over 10 years?
Chart 10[6]: Mag 7% of US market cap (S&P 500)
Technology, AI and Risks
This focus on a handful of tech giants gives rise to serious technology concentration risk as well as higher volatility and higher exposure to more expensive stocks.
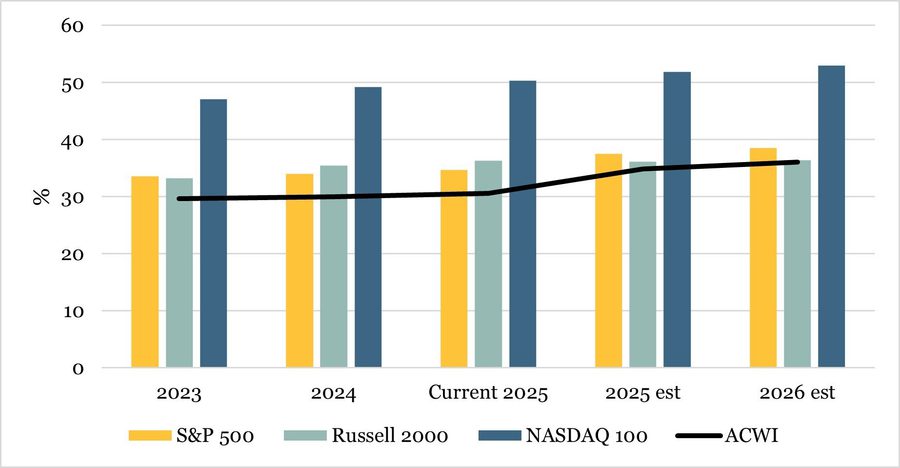
Chart 11[7]: Global equity sector exposure 2020-2024

Chart 12[7]: Mag 7 volatility
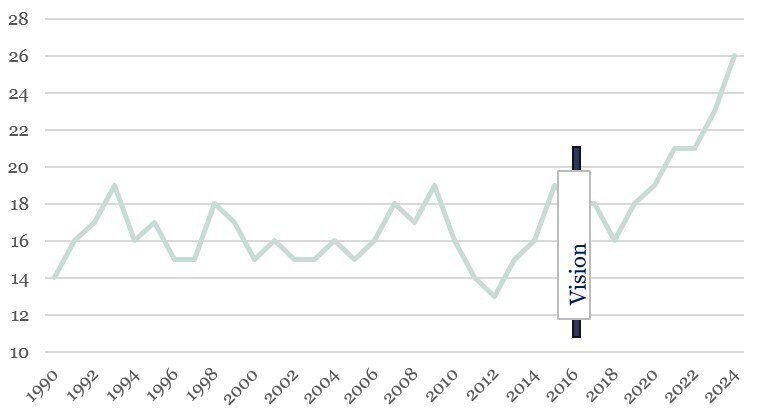
Chart 13[7]: P/E ratios
This exuberance really kicked off with AI day, 30th November 2022, when Chat GPT had its initial release. Since that day US markets pivoted away from value, such that US growth stocks have left US value stocks in their wake ever since.
Chart 14[8]: Growth vs value
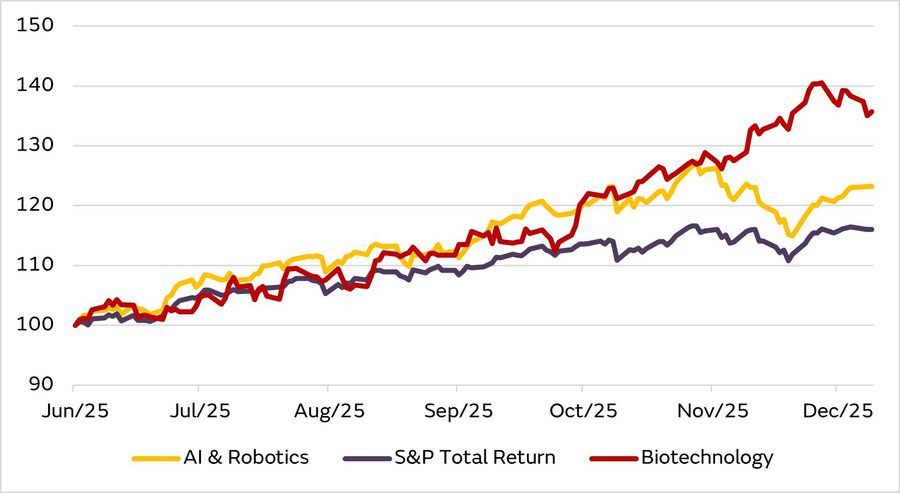
We have no doubt that AI will be transformative, particularly in those industries with iterative processes such as pharmaceuticals and robotics. The AI winners and losers however are yet to be determined and thus AI as an equity valuation factor is still somewhat speculative. The noise of AI has largely drowned out much larger sectors. For example, corporate spending on AI reached $252 billion in 2024 (source: Stanford University) but this is a pittance relative to the $2 trillion invested in clean energy technologies and infrastructure (source: International Energy Agency). Perhaps more notably, clean energy investment is now nearly double that of fossil fuels demonstrating that the energy transition is now an unstoppable force.
At GIB Asset Management we like enthusiasm but caution against exuberant concentration which pushes investment portfolios beyond their long-term objectives.
References
[1] MSCI, GIB Asset Management
[2] World Bank, GIB Asset Management
[3] FRED
[4] FRED, Pregin, GIB Asset Management
[5] Bloomberg, GIB Asset Management
[6] Bloomberg, GIB Asset Management
[7] Bloomberg, MSCI, GIB Asset Management
[8] Morgan Stanley, Bloomberg
This content should not be construed as advice for investment in any product or security mentioned. Examples of stocks are provided for general information only to demonstrate our investment philosophy. Observations and views of GIB AM may change at any time without notice. Information and opinions presented in this document have been obtained or derived from sources believed by GIB AM to be reliable, but GIB AM makes no representation of their accuracy or completeness. GIB AM accepts no liability for loss arising from the use of this presentation. Moreover, any investment or service to which this content may relate will not be made available by GIB to retail customers.
