
The importance of benchmark selection in Fixed Income portfolios
Introduction
The evolution of Equity and Fixed Income indices has followed distinct trajectories, reflecting the unique characteristics of each asset class. Equity indices, tied to exchanges with publicly traded securities, have long benefited from transparent price discovery and consistent methodologies. This facilitated the early creation of benchmarks like the Dow Jones Industrial Average in the late 19th century, the S&P 500 in the late 1950s, and the MSCI Equity Indices, which have been calculated since 1969.
Conversely, the Fixed Income market has presented more challenges in index creation. Due to its over-thecounter structure, identifying constituents and achieving price transparency is inherently more complex. The bond market’s evolution also introduced a broader array of instruments over time. In the 1920s, government bonds dominated the market, with corporate issuance being relatively rare. The landscape began to diversify significantly with the emergence of mortgage-backed securities in the 1970s, followed by junk bonds and municipal bonds in the 1990s. Each of these instruments brought varying credit risks; technical features such as maturity and payback structures; and different interest mechanisms (floating or fixed coupons). This complexity delayed the widespread development of Fixed Income indices until the early 2000s, although the early benchmarks go back to 1973.
The evolution of the Fixed Income indices
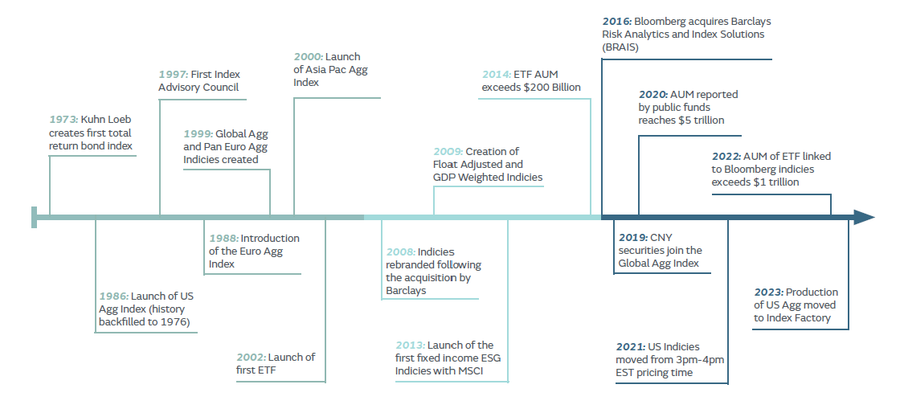
The timeline below1, provided by Bloomberg, highlights some of the major milestones since the first Fixed Income was created in 1973. In particular, there has been significant innovation and growth since Bloomberg acquired the indicies in 2016.
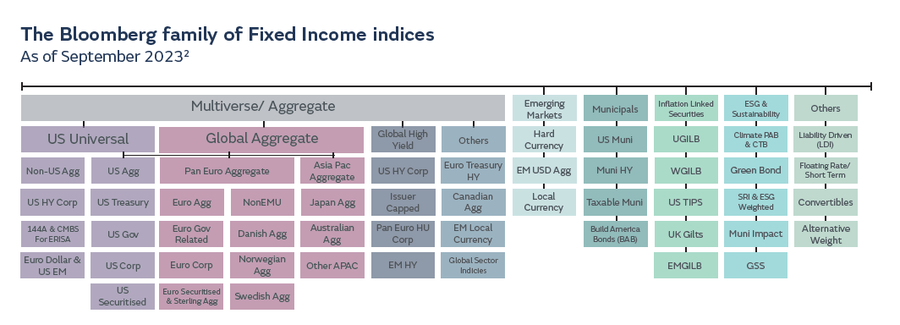
Today, the Fixed Income market is characterised by a proliferation of benchmarks, each designed to isolate specific factors such as currency, credit risk, issuer type, or country. In fact, Bloomberg, one of the leading Fixed Income index providers, currently publishes more than 40,000 standard and bespoke indices daily representing more than 120 countries and 38 local currency debt markets. (1) The sheer number of indices, combined with their nuanced differences—where, for instance, a ‘credit index’ may differ materially from a ‘corporate index’—makes the landscape opaque, particularly for those unfamiliar with fixed income. Thus, while Equity and Fixed Income indices may initially seem to perform similar functions, it is crucial to recognise their fundamental differences.
This complexity has also opened the door to a degree of creativity—and in some cases, manipulation—when it comes to benchmark selection. Fixed Income portfolio managers may, at times, choose benchmarks that are easier to outperform rather than those that align best with their clients’ long-term objectives. This practice can be detrimental to investors, particularly if there is a significant mismatch between the average credit rating of the benchmark and that of the portfolio. A materially higher average benchmark credit rating can flatter apparent performance, whilst also not being transparent about the underlying risks.
For example, consider the difference between a credit benchmark and a corporate benchmark. A corporate index typically includes investment-grade bonds issued by corporations, while a broader credit index typically includes bonds associated with governments – either agencies like national development banks or supranationals such as the EU. Credit benchmarks tend to have materially higher average ratings than corporate ones. If a portfolio manager selects a credit benchmark with a significant allocation in supranationals, but then invests heavily in lower-rated, higher-yielding corporate debt, the portfolio could easily outperform the benchmark simply due to the increased risk and yield of the underlying holdings. This approach can create the illusion of superior performance, while in reality, the outperformance is primarily due to the higher risk profile, which isn’t properly reflected by the conservative credit benchmark. For investors, this lack of alignment obscures the true level of risk being taken, potentially exposing them to unexpected volatility and credit events.
For investors and asset allocators, the choice of benchmark is therefore a critical consideration. It is important to question the rationale behind a portfolio manager’s benchmark selection, particularly in the Fixed Income space where the range of options is vast and varied.
Our approach to benchmark selection
When our Fixed Income team came together to review possible benchmarks for the GIB AM Sustainable World Corporate Bond Strategy, we agreed that a good benchmark should meet the following key criteria:
1. Create compelling long-term total returns: The benchmark should be designed to deliver strong returns over time, aligned with the investor’s goals.
2. Transparency of risk: It should clearly communicate the risks inherent in the investment strategy, allowing investors to make informed decisions.
3. Provide historical perspective: The benchmark should allow investors to perform some historical analysis, showing how it can perform in different market environments.
4. Define the investable universe: It should accurately reflect the universe of assets that the portfolio manager intends to invest in, ensuring consistency between the benchmark and the investment strategy.
5. Challenging to outperform: A good benchmark should be sufficiently robust to provide a meaningful challenge to the portfolio manager, ensuring that outperformance reflects genuine skill rather than an overly lenient benchmark.
Given the limitations of existing indices, such as the Bloomberg Global Aggregate Index (which is over 70% sovereign and securitised) and the Bloomberg Multiverse Index (with residual emerging market exposure), we recognised the need for a custom benchmark. Standard indices like the Bloomberg MSCI Global Green Bond Index also presented challenges, such as a restrictive universe with limited credit exposure (predominantly AA) and consequently, lower yield.
To better reflect our strategy and align with our long-term investment goals, we designed a custom benchmark: 60% Global Investment Grade (IG), 20% Global High Yield (HY), and 20% Global Emerging Market Corporates (EM) (excluding CCC-rated bonds and with an EM country cap).4 This bespoke benchmark is tailored to our investment philosophy, focusing on transparency, diversification, and the pursuit of strong, sustainable returns. Creating a custom benchmark can mitigate concentration risk and misalignment, ensuring a tailored approach to risk management, in turn giving investors greater confidence in the consistency and relevance of investment outcomes
The benefits of our custom benchmark
Our custom benchmark offers several advantages
- Liquid and diversified: By including a mix of IG, HY, and EM bonds, we open a large and liquid universe and can create a diversified portfolio to capture the number of issuers and superior liquidity of IG.
- Enhanced risk management: The exclusion of CCCrated bonds and the implementation of an EM country cap mitigates extreme risks while still allowing for exposure to growth markets.
- Alignment with investor goals: Our benchmark is designed to align closely with our clients' objectives, focusing on delivering robust total returns over the long term. By registering our custom benchmark with Bloomberg, we also ensured that the benchmark data was accessible for clients and prospects via a ticker.
- Challenge and transparency: By choosing a benchmark that is challenging to outperform, we ensure that any excess returns are a result of genuine skill and strategic insight, rather than an overly permissive benchmark.
How has the custom benchmark performed historically?
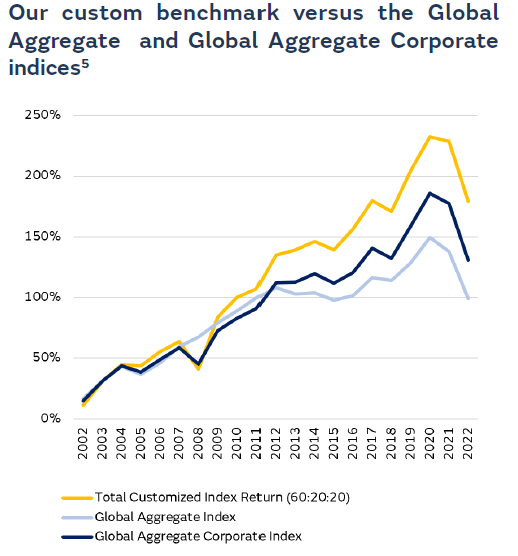
As shown in the chart below, the customised benchmark outperformed the Barclays Global Aggregate Index by around 2% per year (over the last 20 years) and the Aggregate Corporate Index by circa 1% per year (Bloomberg).
Conclusion
In conclusion, the choice of benchmark is not just a technical detail; it is a foundational aspect of portfolio management that directly impacts investment outcomes. We are committed to using benchmarks that not only reflect our strategy but are also transparent, diversified, and aligned with our clients' best interests. Our custom benchmark was created to embody these principles, setting a high standard for performance and accountability in the Fixed Income space. Our Fixed Income team can additionally manage portfolios using more common indices.
This content should not be construed as advice for investment in any product or security mentioned. Examples of stocks are provided for general information only to demonstrate our investment philosophy. Observations and views of GIB AM may change at any time without notice. Information and opinions presented in this document have been obtained or derived from sources believed by GIB AM to be reliable, but GIB AM makes no representation of their accuracy or completeness. GIB AM accepts no liability for loss arising from the use of this presentation. Moreover, any investment or service to which this content may relate will not be made available by GIB to retail customers.
Reference list
(1) Bloomberg, March 2024: Introduction to the Bloomberg Fixed Income Indices
(2) Ibid.
(3) GIB AM Analysis & Bloomberg, 2024
(4) Bloomberg Global Aggregate Investment Grade Corporate incl. High Yield and EM Custom Index (USD Hedged)
This content should not be construed as advice for investment in any product or security mentioned. Examples of stocks are provided for general information only to demonstrate our investment philosophy. Observations and views of GIB AM may change at any time without notice. Information and opinions presented in this document have been obtained or derived from sources believed by GIB AM to be reliable, but GIB AM makes no representation of their accuracy or completeness. GIB AM accepts no liability for loss arising from the use of this presentation. Moreover, any investment or service to which this content may relate will not be made available by GIB to retail customers.